3.0 ALTERNATIVES ANALYSIS
3.1 DEVELOPMENT OF PLAN ALTERNATIVES
The following sections discuss the development and evaluation of the cost-effectiveness of major nutrient load reduction alternatives and strategies.
3.1.1 Potential Reduction of Internal Nutrient Loads
As discussed in Section 1.1 above, the primary lake management issue that precipitated the public demand for action on Lake Tarpon was water quality degradation, as exhibited by a major algae bloom in 1987. Excess nutrient loading has been identified as the most significant cause of water quality degradation in the lake, leading to nuisance algae blooms, rapid aquatic weed growth and other symptoms of eutrophication.
The annual nutrient budgets for Lake Tarpon indicate that approximately 36.5 percent of the TN, and 72.2 percent of the TP inputs, are retained within the lake via both deposition in lake sediments and assimilation in macrophytic plant tissue. Although it is difficult to accurately quantify the mass of nutrients annually released back into the water column in association with natural macrophyte die-offs, water quality trends indicate that this mass may be substantial following large scale chemical treatment of hydrilla. These internal nutrient stores represent a potentially major source of nutrient loadings to the water column under certain conditions via internal recycling processes. There are essentially four viable methods to effectively reduce internal nutrient recycling in shallow warm-water lakes. These include:
phosphorus inactivation and precipitation (e.g., whole lake alum treatments);
sediment removal (e.g., dredging);
flushing and dilution (e.g., lake drawdowns); and
biomanipulation (e.g., biomass removal via mechanical harvesting of aquatic vegetation).
With regard to phosphorus inactivation and precipitation in Lake Tarpon, preliminary discussions with the FDEP have indicated that in-lake applications of alum will be highly scrutinized from a regulatory perspective. This is because there is the potential for violating the Class-III Marine water quality standard for aluminum in Tampa Bay downstream of the outfall structure. In addition, there is the potential for aluminum toxicity in unstable pH environments, which have been observed in Lake Tarpon under certain conditions (e.g., in 1991 following the accidental lake drawdown). Given the economic importance of the Lake Tarpon sport fishery and other recreational uses, the potential toxicity and public perception of risks associated with whole lake alum treatments are considered to be unacceptable. The FDEP has, however, indicated that the construction of off-line alum injection ponds to treat stormwater in the watershed would be permittable because of the additional controls on the release of aluminum salts into the lake and downstream waters (e.g., floc settling ponds). Furthermore, there is a comparable and local precedent for alum injection ponds in the Lake Maggiore and Sawgrass Lake watersheds which also discharge to Tampa Bay. The Sawgrass Lake facility is also located in a Pinellas County Park.
Sediment removal is not considered to be a viable or cost-effective management option in Lake Tarpon due to the fact that lake sediments are relatively low in organic content, and the lake is relatively deep, compared to more eutrophic and recreationally impaired systems like Lake Maggiore and Lake Seminole, the other large lakes in Pinellas County. In contrast to Lake Maggiore where the dredging of lake sediments is the preferred management approach, sediment resuspension and nutrient release in Lake Tarpon is not considered to be a problem which contributes significantly to algal blooms. Modeling results indicate that Lake Tarpon sediments are a sink for phosphorus but that a small flux of nitrogen back to the water column occurs under certain conditions.
Conversely, increased flushing and dilution of the lake water volume, and mechanical harvesting of nuisance aquatics, are both viable and potentially cost-effective management options for reducing internal nutrient loads in Lake Tarpon. Using modeling techniques, the impact of these two internal load reduction strategies on in-lake water quality has been assessed, the results of which are discussed in Section 3.3 below.
3.1.2 Potential Reduction of External Nutrient Loads
The only external sources of nutrient loadings to Lake Tarpon that are considered to be manageable (e.g., can feasibly be reduced through remediative measures) include direct runoff (48.6% of the total TN load and 68.8% of the total TP load) and leachate from septic tanks (11.5% of the total TN load and 14.0% of the total TP load). The other major external sources, including atmospheric deposition and groundwater inflows, are considered to be unmanageable from a practical standpoint. In addition, nutrient loadings from Brooker Creek are also considered to be essentially unmanageable given the relatively natural character of the basin. Furthermore, loadings from Brooker Creek are not likely to be reduced through the construction of regional stormwater treatment facilities due to the fact that Pinellas County has already purchased the majority of the contributing land area as a preservation area, and such facilities would likely be inconsistent with the designated uses of the preserve.
The abatement of external nutrient loading sources as a means of reducing the impacts of cultural eutrophication is axiomatic in the field of lake management. Land-based best management practices (BMPs) are designed to be implemented in the watershed, and afford treatment to non-point source loads prior to the load entering the lake. In contrast, lake-based BMPs are designed to function in the lake itself, and are designed to more effectively assimilate or mitigate nutrient loadings after the pollutants enter the lake. Although in-lake options like sediment removal can be extremely effective in reducing the trophic state index of some lakes, such as shallow lakes with excessive volumes of nutrient-enriched flocculent sediments, in-lake options are rarely as effective alone as when they are combined with reductions in external nutrient loads. With the exception of sediment removal, the most costly lake management options typically involve the rehabilitation of stormwater and wastewater discharges as a means reducing external nutrient loadings. Given the relative importance of external nutrient loads to the Lake Tarpon nutrient budget (compared to internal loads from nutrient recycling), and the potentially high cost of the various external load reduction strategies, only those Plan alternatives aimed at external load reduction were subjected to cost-effectiveness analyses. The results of those analyses are discussed in the following sections.
3.2 COST-EFFECTIVENESS ANALYSIS OF PLAN ALTERNATIVES
Given the above considerations, one of the essential steps in developing the Plan was the evaluation of potential management alternatives that could be implemented to reduce external nutrient loadings to the lake. Watershed-based BMPs aimed at reducing the external total nitrogen (TN) and total phosphorus (TP) loads to Lake Tarpon were developed and evaluated for their potential effectiveness and comparative unit costs. Unit costs were estimated on the standardized basis of dollars per pound of TN or TP removed from the annual loadings to the lake that would result from implementing a particular BMP.
The purpose of this section is to summarize the methods, assumptions, and results of a comparative evaluation of watershed-based BMPs designed to reduce external nutrient loadings to Lake Tarpon. Various BMPs were evaluated with respect to their potential pollutant load reduction and relative cost. The BMPs that were evaluated address the pollution generated from stormwater runoff and septic tank leachate in the priority sub-basins and manageable hydrologic units (MHUs), and were chosen based on current practice in other similar situations and through consultation between Coastal/PBS&J, PCDEM, and the Lake Tarpon Management Committee. These BMPs include:
1. Providing centralized sanitary sewer service to all remaining unsewered portions of the basin, and requiring the hook-up of all residences and businesses still on septic tanks;
2. Retrofitting the four priority MHUs, and the two priority individual sub-basins, with wet detention stormwater ponds; and
3. Retrofitting the four priority MHUs, and the two priority individual sub-basins, with alum injection treatment of stormwater with floc accumulation (sediment trap) ponds.
Other less studied land-based BMP alternatives, such as periphyton filters, were considered but not evaluated due to a lack of comparative data. As such information becomes available, similar analyses should be applied throughout the implementation of the Plan.
Non-point source loadings in the Lake Tarpon drainage basin include stormwater runoff and septic tank leachate that reaches the lake. BMPs were then evaluated by comparing their unit costs; that is, the cost for removing one pound of TN or TP from the land-based loading to the lake
In addition to unit costs ($/lb TN or TP removed), BMPs were also evaluated on the basis of a standardized time period. Cost estimates for stormwater treatment ponds and alum injection systems were developed using an expected 20-year life of the facility. Similarly, the construction of central sewer facilities and the removal of septic tanks also entails long term capital and maintenance costs. Therefore, estimated annual costs for each of the three BMPs evaluated were determined for the same time scale - 20 years. Cost information was obtained from several sources as described below.
3.2.1 Conversion of Septic Tanks to Sanitary Sewer Service
Septic tanks were identified as a major source of TN or TP on a lake-wide basis, and were estimated to contribute approximately 11.5 percent of the external TN load and 14 percent of the external TP load to the lake during the period 1988-93 (Coastal Environmental, 1995). In addition to their contribution to the overall lake nutrient budget, leachate from septic tanks may be a very important source of nutrients for localized portions of the lake, especially areas with limited circulation such as residential canals. Septic tank leachate may also create a human health hazard if discharges occur in the lake or canals near swimming areas or intakes for private landscape irrigation systems.
Estimating the cost-effectiveness of replacing septic tank systems with sanitary sewer service required completion of the following steps:
1. Estimate TN and TP loading from existing septic tank systems;
2. Estimate TN and TP loading to Lake Tarpon if the residences and businesses now using septic tanks converted to sanitary sewer;
3. Calculate the difference in TN and TP load that would result from converting septic tank service areas to sanitary sewer service areas;
4. Estimate the cost of converting septic tank service areas to sanitary sewer service; and
5. Estimate the unit cost ($/lb TN and TP removed) for converting septic tank service to sanitary sewer service.
The following methods were used to estimate the cost-effectiveness of converting septic tank service areas to sanitary sewer service.
1. Estimate TN and TP loading from existing septic tank systems.
Estimates of TN and TP loadings from septic tank systems were made for the Lake Tarpon drainage basin as described in the Task 3.2.4 Interim Report, Review of Pollutant Loading Sources and the Selection of Priority Drainage Areas (Coastal Environmental, 1995). In that document, TN and TP loading estimates from existing septic tank systems were first developed by identifying areas in the Lake Tarpon drainage basin with sanitary sewer service. All areas not identified by Pinellas County and City of Tarpon Springs utility planners as served by sanitary sewer were assumed to be served by individual septic tank systems. The approach taken included the following steps:
Count homes and businesses within septic tank service areas from 1"=200' scale aerial photographs;
Measure the distance of buildings, or groups of buildings, to the lake or a tributary;
Estimate the TN and TP loading from each building or group of buildings using estimated sewage flows per household, TN and TP concentration in the effluent, and an algorithm that attenuates the pollutant load in groundwater based on the distance of the septic tank system to the receiving water; and
Sum the individual loads to obtain a total TN and TP load to the lake from septic tank leachate.
Using these methods, 1,076 septic tanks were identified in the Lake Tarpon drainage basin. Approximately 0.20 million gallons per day (mgd) of leachate was estimated to be discharged through septic tank systems in the basin. TN and TP loadings from septic tanks to Lake Tarpon were estimated to be approximately 6.49 tons/year and 0.82 tons/year, respectively. This represents about 11.5 and 14.0 percent of the total external TN and TP loads to the lake, respectively.
2. Estimate TN and TP loadings to Lake Tarpon if the residences and businesses now using septic tanks converted to sanitary sewer.
The wastewater treatment plant (WWTP) serving the largest portion of the basin is the Pinellas County North County Regional WWTP. This WWTP provides advanced wastewater treatment (AWT), and disposes of the treated effluent through spray irrigation of reclaimed water throughout the north county area. In addition, the City of Tarpon Springs WWTP also provides sewer service to a portion of the basin. This plant currently provides secondary level treatment and discharges treated effluent to the Anclote River. The City does, however, have plans to upgrade the plant to AWT standards. The following conservative assumptions were used to estimate TN and TP loading to Lake Tarpon from the residences and businesses now using septic tanks, if those facilities were converted to sanitary sewer service.
The estimated septic tank flows of 0.20 mgd would be treated at a WWTP instead of by septic tank systems.
The septic tank flows would be treated to AWT standards and returned to the basin for spray irrigation using reclaimed water.
All reclaimed water would have the maximum nutrient concentrations allowable for AWT effluent, which are 3.0 mg/l for TN, and 1.0 mg/l for TP
Only a portion of the sprayed effluent would reach the lake. Coastal Environmental (1995) estimated that 13% of the currently sprayed effluent reaches the lake or its tributaries.
Based on these assumptions, TN and TP loadings to the lake would result only from the additional spray irrigation of AWT effluent generated by the residences and businesses now using septic tanks. If those facilities were converted to sanitary sewer service, the estimated residual nutrient loads would equal approximately 238 lb/year, or 0.12 tons/year for TN; and approximately 80 lb/year, or 0.04 tons/year for TP. These estimates were derived as follows:
TN load:
(0.20)(0.13)(3.0)(8.342)(356)(1/2000) = 0.12 tons TN/year
and,
TP load:
(0.20)(0.13)(1.0)(8.342)(356)(1/2000) = 0.04 tons TP/year
where:
total flow = 0.20 mgd
fraction of total flow reaching the lake = 0.13
TN concentration = 3.0 mg/L
TP concentration = 1.0 mg/L
conversion factor = 8.342
3. Calculate the TN and TP load reduction that would result from converting septic tank service areas to sanitary sewer service areas.
The difference in TN and TP loading resulting from implementing this BMP is calculated by subtracting the septic tank load from the sanitary sewer load. These estimates were derived as follows:
TN load reduction:
6.49 tons/year (septic tank load) - 0.12 tons/year (sanitary sewer load)
= 6.37 tons/year
TP load reduction:
0.82 tons/year (septic tank load) - 0.04 tons/year (sanitary sewer load)
= 0.78 tons/year
Thus, converting septic tank service areas to sanitary sewer service areas could potentially reduce the TN load to Lake Tarpon by approximately 6.37 tons/year, or 12,740 lb/year (98% load reduction), and reduce the TP load to the lake by approximately 0.78 tons/year, or 1,560 lb/year (95% load reduction).
4. Estimate the cost of converting septic tank service areas to sanitary sewer service.
Both Pinellas County and the City of Tarpon Springs have Capital Improvement Plans (CIP) for extending existing sanitary sewer service into areas of their jurisdictions now served by septic tank systems. Utility planners from both jurisdictions were interviewed during the development of the Lake Tarpon Drainage Basin Management Plan. Estimates of the projected costs for extending sanitary sewer service throughout the Lake Tarpon drainage basin were made based on estimates obtained from the utility planners, or from Sanitary Sewer Master Plans and typical costs for other sewer improvements within the County and City sewer district jurisdictions.
Cost calculations for sanitary sewer service area extensions for Pinellas County and the City of Tarpon Springs that would replace the remaining 1,076 total septic tank systems were made. Using current unit costs and typical construction specifications provided by government utility planners, an average total cost per unit (e.g., residence or business) of $8,610 was calculated. Thus, a total cost of approximately $9,264,400 would be required to convert all 1,076 septic tanks to sanitary sewer.
It must be noted that unit costs per residence or business are quite variable and depend on the distance of existing sanitary sewer lines to new areas, number and density of residences and businesses to be served, land costs and the location of existing right-of-ways, topography and the need for lift stations, etc. Utility planners indicated that those septic tank systems not included in CIP plans for replacement were not addressed because they are relatively far away from existing collection lines, are very sparsely distributed, or are isolated with respect to access to collection line corridors. Based on this analysis, 242 of the total 1,076 septic tanks in the basin are not included in existing County and City CIP plans due to the above factors. Because they would be more expensive, on a per unit basis, to replace, than those addressed in CIP plans, the $8,610 per unit cost most likely represents the low end of the range of costs for septic tank replacement, if the remaining 242 septic tanks were also to be replaced with sanitary sewer service.
5. Estimate the unit cost ($/lb TN and TP removed from loadings) for converting septic tank service to sanitary sewer service.
The last step in estimating the cost-effectiveness of this BMP is to divide the total cost of converting septic tank users to sanitary sewer by the reduction in TN and TP load that would result from this management action. The total cost for replacing septic tank systems with sanitary sewer was estimated to be $9,264,400. The total TN reduction was estimated to be 12,740 lb/year (254,800 lb in 20 years) and the TP reduction was estimated to be 1,560 lb/year (31,200 lb in 20 years). Therefore, the unit cost of converting all septic tanks in the basin to sanitary sewer service is ($9,264,400/254,800 lb TN), or $35/lb TN, and ($9,264,400/31,200 lb TP), or $297/lb TP.
3.2.2 Stormwater Rehabilitation with Wet Detention Ponds
Treating stormwater using wet detention ponds is a common method of reducing pollutant loading for a wide range of nutrients and contaminants, as well as controlling stormwater attenuation and discharge rates. Wet detention ponds are relatively easy to construct and maintain, but their efficiency varies with a number of factors including seasonal weather patterns, construction design, and routine maintenance. The cost-effectiveness of using wet detention ponds (ponds) to treat stormwater runoff from each of the five priority MHUs was estimated using unit costs and assuming that existing facilities would be available for enhancement or enlargement. Estimating the cost-effectiveness of wet detention ponds involved the following steps:
1. Identify five priority MHUs with the highest TN, TP, and TSS loadings.
2. Determine the TN and TP load reduction that could be achieved at each priority MHU and individual sub-basin by constructing, upgrading, or improving wet detention ponds.
3. Estimate the cost of constructing, upgrading, or improving wet detention ponds for each priority MHU and individual sub-basin.
4. Estimate the unit cost ($/lb TN and TP removed) for treating direct runoff from the priority MHUs and individual sub-basins with wet detention ponds.
The following methods were used to estimate the cost-effectiveness of using wet detention ponds to treat stormwater runoff. The following section summarizes how these steps were accomplished.
1. Identify priority MHUs and individual sub-basins with the highest TN, TP, and TSS loadings.
Estimates of TN and TP loadings from stormwater (non-point source) runoff were made for the Lake Tarpon drainage basin as described in the Task 3.2.4 Interim Report, Review of Pollutant Loading Sources and the Selection of Priority Drainage Areas (Coastal Environmental, 1995). In that document, non-point source loadings for 67 sub-basins in the Lake Tarpon drainage basin were estimated using an empirical hydrologic model based on land use, soils, rainfall, and sub-basin boundaries. Hydrologically connected sub-basins were treated as a single manageable unit, and were termed "manageable hydrologic units" (MHUs). The MHUs and/or individual sub-basins with the highest TN, TP, and TSS loadings from direct runoff were identified and then ranked for priority based on pollutant load and other logistical factors. Based on this ranking process, the identified MHUs and individual sub-basins included the following listed in order of decreasing priority:
Group-B MHUs (contributing sub-basins 49, 51, 52, and 54);
Group-D MHUs (contributing sub-basins 5 and 6);
Group-A MHUs (contributing sub-basins 60, 62, 63, 65, and 66);
Group-C MHUs (contributing sub-basins 45, 46, and 47);
Individual sub-basin 23; and
Individual sub-basin 21.
Table 3-1 below shows the area and modeled annual flows and TN and TP loads for the priority MHUs and individual sub-basins.
Table 3-1. Summary of modeled loads from the priority MHUs and individual sub-basins.
Treatment Area |
Area (acres) |
Runoff (cfs) |
TN Load (tons/year) |
TP Load (tons/year) |
Group B MHUs (sub-basins 49, 51, 52, and 54) |
713.3 |
1.29 |
1.63 |
0.22 |
Group D MHUs (sub-basins 5 and 6) |
436.2 |
1.03 |
1.61 |
0.15 |
Group A MHUs (sub-basins 60, 62, 63, 65 and 66) |
569.8 |
0.80 |
1.11 |
0.20 |
Group C MHUs (sub-basins 45, 46, and 47) |
337.2 |
0.68 |
0.85 |
0.08 |
Sub-basin 23 |
211.6 |
0.44 |
0.67 |
0.05 |
Sub-basin 21 |
114.6 |
0.24 |
0.45 |
0.03 |
Totals % of direct runoff load % of total loads |
2,382.7 --- --- |
4.48 21.5% 9.1% |
6.32 23.0% 11.2% |
0.73 18.1% 12.5% |
2. Determine the TN and TP load reduction that could be achieved at each priority MHU and individual sub-basin by constructing, upgrading, or improving wet detention ponds.
The magnitude of TN and TP load reduction that may be accomplished through the use of wet detention ponds was estimated by completing a conceptual design of ponds necessary to treat the regulatory runoff volume per SWFWMD Management and Storage of Surface Waters (MSSW) standards. The following assumptions were made to estimate the amount of TN and TP load that would be available for treatment, and the load reduction that could be accomplished through use of wet detention ponds:
90% of all storms are of one inch rainfall or less.
75% of all those storms are temporally spaced to allow bleeddown of the ponds, so that the full storage volume is available for a new storm.
TN treatment efficiency is 0.30, and TP treatment efficiency is 0.60.
Therefore, the annual TN and TP loads that could be removed through use of wet detention ponds were calculated as follows:
TN load reduction:
(Total annual non-point source TN load) x (0.9) x (0.75) x (0.3)
= 1.28 tons (20.3%)
TP load reduction:
(Total annual non-point source TP load) x (0.9) x (0.75) x (0.6)
= 0.30 tons (41.1%)
Based on this analysis, the annual non-point source nutrient loads from the priority MHUs and individual sub-basins can feasibly be reduced by 20.3 percent for TN, and 41.1 percent for TP, using wet detention ponds.
3. Estimate the cost of constructing, upgrading, or improving wet detention ponds for each priority MHU and individual sub-basin.
The wet detention ponds were sized to treat the first ½-inch of runoff from the priority MHUs and individual sub-basins. The standardized pond design included a three-foot depth, with 15 percent of the site dedicated to landscaping. The ponds were assumed to be square to estimate perimeter length. Pond cost included all site work, clearing, piping, control structures, fencing, etc.
Land acquisition cost was assumed to be a constant $50,000/acre based on information provided by the Pinellas County Tax Assessors office. It should, however, be noted that land costs in constrained urbanized areas can be substantially higher than this value. Operating and maintenance (O&M) costs included one man-week per site per year, as well as the cost of miscellaneous supplies.
In summary, total costs, including land acquisition, construction, and O&M were estimated to be $2,309,622 for the 20-year life span of six (6) wet detention ponds, or approximately $384,937 per pond.
4. Estimate the unit cost ($/lb of TN and TP removed from loadings) for treating stormwater with wet detention ponds.
The last step in estimating the cost-effectiveness of this BMP was to divide the total 20-year cost (capital plus O&M) of wet detention ponds for the six priority MHUs and individual sub-basins by the reduction in TN and TP load that would result from implementing this management action. The total cost was estimated to be $2,309,622. The total TN reduction was estimated to be 1.28 tons or 2,560 lb/year (51,200 lb in 20 years) and the TP reduction was estimated to be 0.30 tons or 600 lb/year (12,000 lb in 20 years). Thus, the unit cost of treating direct runoff from the priority MHUs and individual sub-basins with wet detention ponds is ($2,309,622/51,200 lb TN), or $45/lb TN, and ($2,309,622/12,000 lb TP) or $192/lb TP.
3.2.3 Stormwater Rehabilitation with Alum Injection
Treating stormwater by injecting alum into the runoff stream prior to the stormwater discharging into a receiving water is a relatively new, and still somewhat experimental, method of reducing pollutant loading. Alum injection results in the introduction of significant volumes of alum flocculant (floc) into the water column, and concerns have been raised regarding potential toxicity of the alum as it settles and accumulates in the sediments of the receiving water. To reduce the amount of floc that may enter the receiving water, a small pond may be constructed downstream of the injection point, so that the alum, with the associated adsorbed suspended solid material and pollutants, can settle out of the water column prior to entering the receiving water. These sediment traps, or forebays, are relatively easy to construct and maintain, but their efficiency varies with a number of factors, including basin size and routine maintenance.
The cost-effectiveness of using alum injection with ponds to treat stormwater runoff from each of the priority MHUs and individual sub-basins was estimated using unit costs and assuming that some existing ponds and stormwater facilities would be available for enhancement or enlargement. Estimating the cost-effectiveness for alum treatment involved the following steps:
1. Identify five priority MHUs with the highest TN, TP, and TSS loadings.
2. Determine the TN and TP load reduction that could be achieved at each priority MHU and individual sub-basin by installing and operating an alum injection system with a sediment trap.
3. Estimate the cost of installing and operating an alum injection system with a sediment trap for each priority MHU and individual sub-basin.
4. Estimate the unit cost ($/lb TN and TP removed) for treating direct runoff from the priority MHUs and individual sub-basins with with alum injection.
The following methods were used to estimate the cost-effectiveness of treating stormwater runoff by alum injection.
1. Identify priority MHUs and individual sub-basins with the highest TN, TP, and TSS loadings.
As discussed in Section 3.2.2 above, estimates of TN and TP loadings from stormwater (non-point source) runoff were made for the Interim Task 3.2.4 Interim Report. In that document, non-point source loadings for 67 sub-basins in the Lake Tarpon drainage basin were estimated using an empirical hydrologic model based on land use, soils, rainfall, and sub-basin boundaries. Hydrologically connected sub-basins were treated as a single manageable unit, and were called "manageable hydrologic units" (MHUs). The MHUs and/or individual sub-basins with the highest TN, TP, and TSS loadings from direct runoff were identified and then ranked for priority based on pollutant load and other logistical factors. Based on this ranking process, the identified MHUs and individual sub-basins included the following listed in order of decreasing priority:
Group-B MHUs (contributing sub-basins 49, 51, 52, and 54);
Group-D MHUs (contributing sub-basins 5 and 6);
Group-A MHUs (contributing sub-basins 60, 62, 63, 65, and 66);
Group-C MHUs (contributing sub-basins 45, 46, and 47);
Individual sub-basin 23; and
Individual sub-basin 21.
Table 3-1 above shows the area and modeled annual flows and TN and TP loads for the priority MHUs and individual sub-basins.
2. Determine the TN and TP load reduction that could be achieved at each priority MHU by installing and operating an alum injection system with sediment traps.
The magnitude of TN and TP load reduction that may be accomplished through the use of alum injection with sediment traps was estimated by completing a conceptual design of the systems necessary to treat runoff from the five priority MHUs. Design criteria were based on specifications for other local alum systems that have recently been designed and constructed (ERD, 1994). The following assumptions were made to estimate the amount of TN and TP load that would be available for treatment, and the load reduction that could be accomplished through use of alum injection systems:
90% of all storms are of one inch rainfall or less.
75% of all those storms are temporally spaced to allow bleeddown of the ponds, so that the full storage volume is available for a new storm.
TN removal efficiency for injected alum is 0.40, and TP treatment efficiency is 0.90.
Therefore, the annual TN and TP loads that could be removed through use of alum injection ponds were calculated as follows:
TN load reduction:
(Total annual non-point source TN load) x (0.9) x (0.75) x (0.4)
= 1.71 tons (27.0%)
TP load reduction:
(Total annual non-point source TP load) x (0.9) x (0.75) x (0.9)
= 0.44 tons (61.1%)
Based on this analysis, the annual non-point source nutrient loads from the priority MHUs and individual sub-basins can feasibly be reduced by 27.0 percent for TN and 61.1 percent for TP using alum injection ponds.
3. Estimate the cost of installing and operating an alum injection system with a sediment trap for each priority MHU and individual sub-basin.
Costs for installation, operation, and maintenance of alum injection systems with sediment traps for the four priority MHUs and two individual sub-basins (e.g., a total of six treatment facilities) were estimated using unit costs listed for similar systems (ERD, 1994).
Capital costs included buildings, pumps, mixers, pipes, meters, etc. Costs for constructing sediment trap ponds were also estimated using the same unit costs as for the wet detention option. Ponds were designed so as to allow a minimum holding time of three hours for a storm event with one inch rainfall or less. It was assumed that new ponds would be constructed, or that existing ponds would be enlarged to accommodate the inflows. Thus, either new pond construction or existing pond enlargement had the same costs. Pond construction costs were estimated to total $1,076,465. It was assumed that capital costs for each alum injection system would be identical, and were estimated to be $223,618 per unit, including both pond construction and the installation alum injection pumps and chemical holding tanks. The total capital cost for the six treatment facilities was estimated to be $1,341,708.
Annual operating costs included chemical purchases (aluminum sulfate and sodium hydroxide) at $0.50/gallon and $2.00/gallon, respectively. Maintenance costs for alum injection systems over the projected 20-year life of the facility included replacement of major mechanical parts (injectors, pumps, etc.). Other annual costs included operating and maintenance (O&M) labor of one person approximately one-half time, plus one month per year for each outfall. This equates to 85 percent of one man-year. A typical technician labor rate of $15/hour was used which included overhead. Total annual O&M costs were estimated to be $139,724 per year for six facilities. For the final cost estimates of dollars per pound of nitrogen and phosphorus removed, annual recurring O&M costs were spread over the 20-year projected life of the project. It should be noted that others have projected an effective alum injection system life span to be 30 years (ERD, 1994).
In summary the total cost of constructing, operating and maintaining six alum injection treatment facilities with sediment traps over the 20-year life of the project was estimated to be $4,136,188.
4. Estimate the unit cost ($/lb TN and TP removed from loadings) for treating stormwater with alum injection.
The last step in estimating the cost-effectiveness of this BMP was to divide the total 20-year cost (capital plus O&M) of alum injection systems for the six priority MHUs and individual sub-basins by the reduction in TN and TP load that would result from implementing this management action. The total cost was estimated to be $4,136,188. The total TN reduction was estimated to be 1.71 tons or 3,420 lb/year (68,400 lb in 20 years) and the TP reduction was estimated to be 0.44 tons or 880 lb/year (17,600 lb in 20 years). Thus, the unit cost of treating direct runoff from the priority MHUs and individual sub-basins with wet detention ponds is ($4,136,188/68,400 lb TN), or $60/lb TN, and ($4,136,188/17,600 lb TP) or $235/lb TP.
3.2.4 Cost-Effectiveness Comparison
Table 3-2 compares the relative costs of total nitrogen (TN) and total phosphorus (TP) removal between the three primary external load reduction strategies: 1) conversion of all remaining septic tanks in the basin to sanitary sewer service; 2) retrofitting the six priority MHUs and individual sub-basins with wet detention stormwater treatment ponds; and 3) retrofitting the six priority MHUs and individual sub-basins with alum injection systems with sediment traps. The unit costs of dollars per pound of TN and TP removed were based on pollutant loading estimates from Coastal Environmental (1995), and total project costs for the three management alternatives as discussed above. All costs are based on a 20-year facility life for equivalent comparison.
Table 3-2. Comparison of Best Management Practices with respect to relative cost-effectiveness for TN and TP removal.
BMP |
Cost Per Pound of TN Removed |
Cost Per Pound of TP Removed |
Septic Tank Conversion |
$35 |
$297 |
Wet Detention Ponds |
$45 |
$192 |
Alum Injection with Sediment Traps |
$60 |
$235 |
Average |
$47 |
$241 |
Note: Costs are amortized over a 20-year facility life.
It should be noted that the accuracy of these costs depends on the validity and accuracy of the assumptions used to make them. The non-point source (stormwater) loadings used for the wet detention pond and alum injection analyses were developed by Coastal Environmental (1995). Because the same values were used for both non-point source options, the unit cost differential arises from estimates of treatment efficiency and facility costs. Wet detention treatment efficiency was based on numerous literature references, as summarized by Coastal Environmental (1996). Alum treatment efficiency was based on bench tests and previous system operating results performed by ERD (1994); whereas costs were based on cost estimates for the Lake Maggiore alum injection system (ERD, 1994).
Of the three external load reduction alternatives evaluated, the conversion of septic tanks to sanitary sewer service provides the most cost-effective solution for nitrogen removal at $35/lb TN. Wet detention ponds are second at $45/lb TN, and alum injection is the most costly at $60/lb TN. Wet detention ponds are the most cost-effective for removing TP at $192/lb TP, followed by alum injection at $235/lb TP, and septic tank conversion at $297/lb TP. All three of the alternatives were relatively close in unit costs, varying by less than 40 percent. The average cost for TN and TP removal for the three alternatives was $47/lb TN and $241/lb TP.
Based on the assumptions and analyses presented above, septic tank conversion is clearly the most effective alternative in terms of total achievable load reduction, followed by alum injection and wet detention ponds. Septic tank conversion requires a substantial capital cost, but ratio of O&M to capital costs is relatively low compared to the other alternatives. An additional benefit of converting septic tank systems to sanitary sewer service is the increased supply of reclaimed water that would be available to offset constraints on potable water use. Wet detention ponds may be similarly used for stormwater reuse for irrigation, but the alum systems would probably have minimum benefits in this manner.
With respect to achievable load reduction for stormwater runoff, especially for TP, alum injection is clearly a better choice than wet detention. Capital costs for wet detention and alum injection ponds are comparable; however, the alum injection requires substantially higher O&M costs. Wet detention ponds require minor periodic maintenance (mowing, fence repair, outfall cleaning, etc.), but alum injection systems require extensive maintenance for re-supplying chemicals, re-setting the instrumentation, periodic inspection of parts for wear for replacement, and cleaning the system pumps, lines, etc. Since the cost-effectiveness of the alternatives was evaluated over a 20-year facility life, the difference in annual O&M costs between wet detention and alum injection becomes significant.
Table 3-3 below presents a summary of the TN and TP reduction potential of the two primary external load reduction alternatives, septic tank conversion and alum injection with sediment traps. This table also shows the unit cost (cost per pound of TN and TP removed) and total cost (project cost amortized over a 20-year facility life) for each alternative.
Table 3-3. Summary of the TN and TP load reduction potential, unit costs and total costs of the two primary external load reduction alternatives.
BMP |
Potential Load Reduction (lbs/year) |
Unit Cost of Load Reduction ($/lb) |
Total Cost of Load Reduction* ($/year) |
|||
TN |
TP |
TN |
TP |
TN |
TP |
|
Septic Tank Conversion |
12,740 |
1,560 |
35 |
297 |
$445,900 |
$463,320 |
Alum Injection with Sediment Traps |
3,420 |
880 |
60 |
235 |
$205,200 |
$206,800 |
TOTALS (% total load reduction) |
16,160 (14.3%) |
2,440 (20.8%) |
--- |
--- |
$651,100 |
$670,120 |
* Annual costs ammortized over 20-year facility life.
From Table 3-3 it can be seen that the two primary external load reduction alternatives, septic tank conversion and alum injection with sediment traps, have the conservative potential to reduce total TN and TP loads to the lake by 14.3 and 20.8 percent, respectively. This potential load reduction is considered to be significant with respect to the trophic state management of Lake Tarpon. Amortized over a 20-year period, the annual cost to achieve this load reduction is $651,100 for TN and $670,120 for TP. This equates to approximately $1,321,220 per year for the combined TN/TP load reduction, amortized over a 20-year period.
3.3 ATTAINABLE BENEFITS OF LOAD REDUCTION STRATEGIES
As discussed above, the abatement of external nutrient loading sources as a means of reducing the impacts of cultural eutrophication is axiomatic in the field of lake management. Therefore, the most critical management alternatives to be considered in the development of the Plan include those aimed at external nutrient load reduction. Nonetheless, the importance and potential impact of internal load reduction strategies cannot be overlooked. Although much more difficult to quantify due to the complexities of nutrient recycling and sediment/water column interactions, internal load reduction strategies such as dilution and flushing and macrophyte harvesting have the potential to contribute to the benefits of external load reduction.
This section summarizes the results of waterbody modeling conducted to predict the trophic state impacts of implementing key components of the Plan aimed at reducing both internal and external pollutant loadings. The results of these modeling runs were subsequently used to develop final suite of Plan components fully described in Section 4.0.
3.3.1 Internal Load Reduction
As discussed above, the two most viable internal load reduction strategies considered for Lake Tarpon include: 1) flushing and dilution; and 2) harvesting of aquatic macrophytes.
Flushing and Dilution
Flushing and dilution is a well-documented lake management technique that involves increasing the rate at which the nutrient mass is flushed from the lake combined with the use of higher quality dilution water to reduce in-lake concentrations of nutrients. Flushing and dilution serve to reduce the concentration of nutrients, and the period of time that aquatic vegetation is exposed to these nutrients. The reduced nutrient concentrations should lead to reduced algal growth and increased water column transparency due to lower algal cell concentrations and, to a lesser extent, the addition of highly transparent water to the lake volume. Increased transparency, in turn, should lead to the proliferation of more desirable rooted aquatic plants (NYSDEC, 1990).
Algal concentrations may be reduced by flushing alone (e.g., the discharge of lake water). If the flushing rate is greater than the algae growth rate, algal cells may be washed out of the lake system. Control can be achieved by a flushing rate of approximately 10-15% per day (NYSDEC, 1990). If flushing alone can be used to decrease algae concentration through washout, then lower quality water can be used, provided that the increases in algal growth rate resulting from the higher nutrient concentrations are not sufficient to exceed the increased flushing rate. Unfortunately, given the lack of an unlimited external supply of dilution water in the Lake Tarpon watershed, flushing rates approaching 10-15% per day are not considered achievable. In addition, dilution water with nutrient concentrations higher than those in the lake may exacerbate the existing water quality problems.
Using mean annual TN and TP concentrations from 1995 water quality data from Lake Tarpon, it is estimated that the discharge of 1.0 foot of water (e.g., from elevation 3.0 to 2.0 NGVD) associated with an enhanced lake level fluctuation schedule would result in a nutrient mass discharge of 4.41 tons of TN and 0.25 tons of TP. Although lake retention time would be slightly reduced, most of the discharged nutrient mass would be replaced by nutrients contained in the inflowing precipitation, runoff and groundwater. Effective dilution of the in-lake nutrient mass would occur only if the cumulative nutrient concentrations in the inflow waters were even slightly lower than in-lake concentrations, but measurements of the nutrient concentrations of inflowing waters indicate that only precipitation is less concentrated than lake water with respect to TN and TP.
For this reason, it is imperative that a source of high quality dilution water be used in Lake Tarpon.Data reported by Upchurch (1998) indicate that Floridan aquifer wells in the vicinity of Lake Tarpon have nutrient concentrations as low a 0.07 mg/l for TN and 0.01 mg/l for orthophosphate. The use of Floridan aquifer water to refill the lake following lake level drawdowns has the potential to dilute in-lake concentrations of TN and TP, and to further decrease lake retention time by adding a source of inflow water that does not currently exist.
Macrophyte Harvesting
Mechanical harvesting is not only effective at controlling nuisance aquatic vegetation, but it can also be used as a means to improve water quality problems related to eutrophication. The growth of aquatic macrophytes requires the assimilation of both water column and sediment nutrients. Physical removal (i.e., harvesting) of the plant biomass is highly effective in preventing the return of the assimilated nutrients to the water column or sediments as the plants senesce and decompose.
Interest in the use of aquatic plants for eutrophication management has increased sharply in the past few years, accompanied by an emphasis on the use of naturally occurring rooted macrophytes for removing both water column and sediment nutrients. There have been several reports published on the successful application of mechanical harvesting of rooted aquatic plants to the mitigation of eutrophication (Souza, et. al., 1988; Frederiksen, 1987). This is an area of aquatic plant management that is expected to be developing rapidly over the next few years.
Mechanical harvesting can directly reduce the coverage of both submergent and emergent nuisance aquatic vegetation. In addition, it will contribute to the removal of nutrients from the lake ecosystem. Using cattail tissue analysis data from Lake Tarpon (Dames & Moore, 1992), the harvesting of 10 acres per year of cattails would result in the removal of approximately 170 tons of dry weight organic matter, and 0.3 tons of TP, from the system
.Based on available harvesting data from Lake Okeechobee (Gremillion et al., 1988), it is estimated that the controlled harvest of approximately 100 acres of hydrilla in Lake Tarpon could result in the annual removal of approximately 12 tons of TN and 1.5 tons of TP per year. If this mass of plant tissue were to senesce and decompose simultaneously, as would be the case after a large scale chemical treatment, the harvesting of this material would result in a very substantial internal load reduction which is equal to approximately 20 and 9 percent of the total annual external TN and TP loads, respectively.
3.3.2 External Load Reduction
Based on the analyses described in Section 3.2 above, the single most cost-effective management action for reducing external nutrient loads to Lake Tarpon is the conversion of all remaining septic tank systems in the basin to central sewer systems. This management action would address nutrient loads associated with septic tank leachate in a highly effective manner.
With regard to the reduction of non-point source nutrient loads associated with stormwater runoff, alum injection with sediment traps is the preferred BMP based on its higher nutrient removal efficiency compared to wet detention ponds. In addition, where land availability or land cost is a constraint, and/or where a higher level of phosphorus removal is desired, alum injection systems are clearly the superior option. These conditions are considered applicable to the Lake Tarpon basin. Finally, although more expensive than wet detention ponds over time, the O&M costs associated with alum injection systems are expected to decrease as treatment technology improves.
3.3.3 Water Quality Impacts of Load Reduction Alternatives
This section presents a summary of the methods and results of statistical and mathematical modeling of Lake Tarpon to predict the water quality impacts of implementing various pollutant load reduction strategies to lower the trophic state of Lake Tarpon.
The first step of this analysis involved the regression of the sum of all modeled and measured external TN and TP loads to Lake Tarpon against measured in-lake chlorophyll-a concentrations for the years 1988 through 1992. The purpose of this analysis was to determine the relationship between measured chlorophyll-a concentrations and external loads.
The period of 1988-1992 was considered to represent a normal baseline period with regard to rainfall variability and other in-lake events such as hydrilla treatment. The one exceptional year over this period was 1990 during which abnormally low in-lake chlorophyll-a concentrations were observed in response to an accidental release of lake water through the outfall canal structure. This event is discussed in detail in Section 2.2.1 above. Chlorophyll-a data from PCDEM were used in this analysis. The total annual loadings used in this analysis included:
modeled direct runoff or nonpoint source loads from the Lake Tarpon basin and the ungaged Brooker Creek basin as a function of annual rainfall depth (as modeled by Coastal Environmental, 1995);
measured loads from the gaged Brooker Creek basin (as reported by USGS);
calculated atmospheric deposition loads using updated local concentration data (as reported by Pribble and Janicki, 1998);
septic tank (OWTS) discharges (as modeled by Coastal Environmental, 1995); and
combined seepage from the surficial and Floridan aquifers (as reported by Upchurch, 1998).
The resulting total annual TN and TP loadings for the period 1988-1992 are summarized in Table 3-4 below.
Table 3-4. Total annual TN and TP loadings to Lake Tarpon for the period 1988-1992 (units in tons/year).
Year |
Modeled Direct Runoff |
Brooker Creek |
Atmospheric Deposition |
Septic Tanks (OWTS) |
Aquifer Seepage |
Totals |
||||||
TN |
TP |
TN |
TP |
TN |
TP |
TN |
TP |
TN |
TP |
TN |
TP |
|
1988 |
32.15 |
4.77 |
36.91 |
5.79 |
10.57 |
0.20 |
6.49 |
0.82 |
2.13 |
0.20 |
88.25 |
11.78 |
1989 |
10.51 |
1.55 |
4.98 |
0.77 |
7.43 |
0.14 |
6.49 |
0.82 |
2.13 |
0.20 |
31.54 |
3.48 |
1990 |
12.61 |
1.87 |
2.45 |
0.38 |
7.19 |
0.14 |
6.49 |
0.82 |
2.13 |
0.20 |
30.87 |
3.41 |
1991 |
22.08 |
3.28 |
12.35 |
1.95 |
9.78 |
0.19 |
6.49 |
0.82 |
2.13 |
0.20 |
52.83 |
6.44 |
1992 |
18.26 |
2.71 |
5.49 |
0.86 |
9.85 |
0.19 |
6.49 |
0.82 |
2.13 |
0.20 |
42.22 |
4.78 |
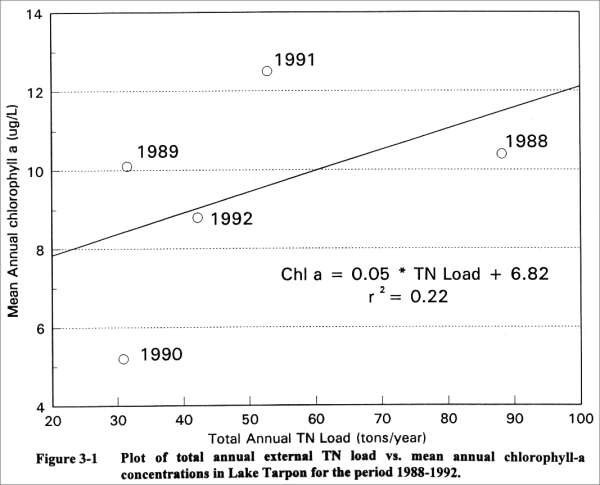
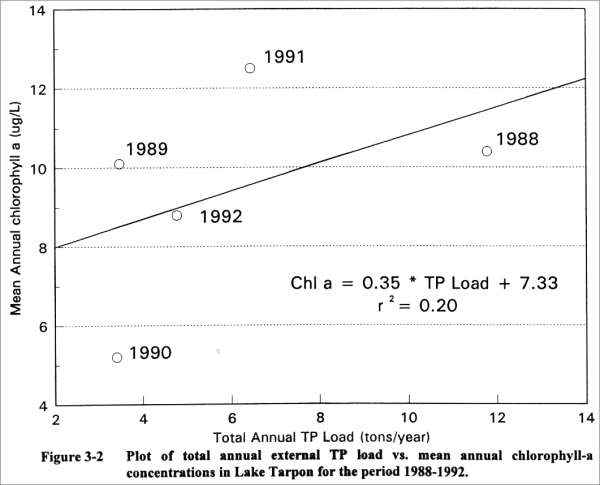
Plots of total annual external TN and TP loadings vs. chlorophyll-a for the period 1988-1992 are shown in Figures 3-1 and 3-2, respectively.
From these plots it can be seen that the relationships between external TN and TP loadings, and chlorophyll-a, are weak as neither the r2 for TN nor TP was significant at P<0.05. The lack of statistical significance in these regressions suggests that internal recycling of nutrients in Lake Tarpon play an important role in determining the trophic state, and that trophic state reductions cannot be effectively achieved through external load reduction strategies alone.
In addition, these plots show that the slope of the regression line is steeper for TP than it is for TN, indicating that reductions of external phosphorus loadings will be more effective at reducing in-lake chlorophyll-a concentrations than comparable reductions in nitrogen loadings. Based on this analysis alone, a 3 ton TP load reduction would be needed to effect a 1 ug/l chlorophyll-a reduction.
Due to the statistical weakness of the regressions of TN and TP vs. chlorophyll-a discussed above, a simplified box model approach was used to simulate the effects of implementing a suite of potential management actions on Lake Tarpon water quality. This analysis addressed the potential impacts of the primary internal and external load reduction strategies discussed previously, and various combinations of these individual management actions. The management actions considered in the modeling evaluations included:
enhanced lake level fluctuation;
enhanced lake level fluctuation with increased lake flushing and dilution;
macrophyte harvesting;
septic tank conversion; and
stormwater treatment in priority MHUs.
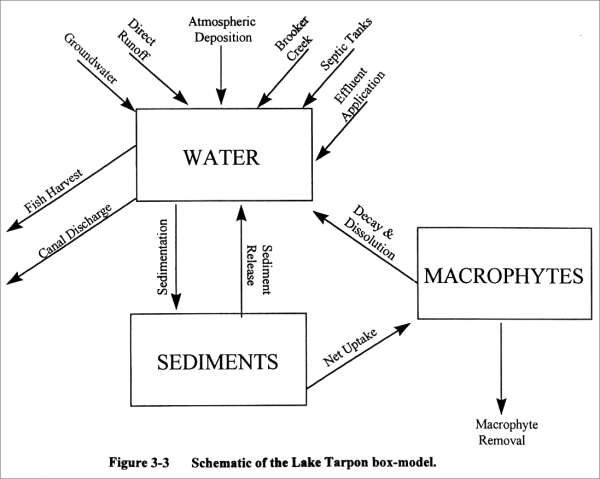
Figure 3-3 shows a schematic of the box model construct. Utilizing the current hydrologic and nutrient loads as presented in Tables 2-1, 2-2, and 2-3 above (e.g., water and nutrient budgets), a simulation of current conditions was made.
To arrive at simulated values as close as possible to observed values, the effects of variations within two parameters were examined. The two parameters were sedimentation of nutrients from the water column, and release of nutrients from the sediments to the water column. As a result of this calibration, the sedimentation of nitrogen from the water column was parameterized as the product of the new simulated water column TN concentration and the sedimentation rate from Table 2-2, divided by the in-lake observed concentration of TN. Similarly, the sedimentation of phosphorus from the water column was parameterized as a function of the new simulated water column TP concentration, the observed in-lake concentration of TP, and the sedimentation rate of TP shown in Table 2-3. The calibration also provided a means of quantifying sediment release of nutrients to the water column to compensate for the lack of reliable empirical data for sediment/water column nutrient flux. For TN, the release rate was constant, with no variation due to changing water quality or sediment quality. For TP, no release was allowed to occur from the sediments.
The model was calibrated to current conditions by simulating as closely as possible average observed conditions, with observed 1995 water column TN concentrations of 1.06 mg/l and observed TP concentrations of 0.042 mg/l. Simulated TN and TP concentrations were 1.09 mg/l and 0.042 mg/l, respectively.
For this modeling effort 20 model scenarios were constructed to examine the various effects of the five individual management actions listed above, and all combinations of these management actions, on the concentrations of TN and TP within the lake water column. All permutations of the five management actions, and the modeling results for each, are summarized in Table 3-5.
Using the current condition simulated concentrations as baseline data for comparison purposes, the model scenarios listed above were run.
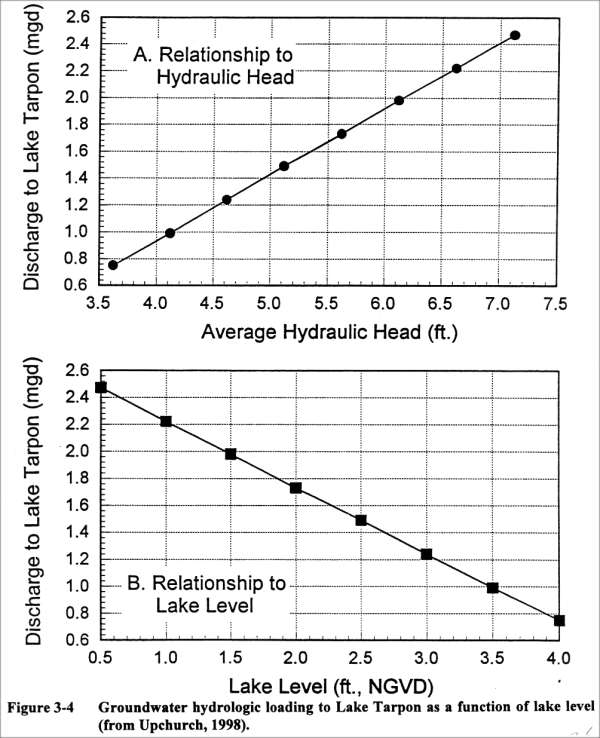
For septic tank conversion and treatment of stormwater from priority MHUs/sub-basins, TN and TP loads were reduced pursuant to the values reported in Table 3-3 above. For the simulation of the effects of enhanced lake level fluctuation on water quality, the surficial aquifer nutrient loadings were allowed to increase as a function of lake level, as per the relationship reported by Upchurch (1998) and shown in Figure 3-4. For this simulation, the lake was drawn down at a constant rate during April and May, then allowed to refill back to its starting point (3.4 NGVD) at a constant rate during June and July. The effects of macrophyte removal were simulated as reducing the sediment release of nitrogen by that fraction of the TN in the macrophytes removed in comparison to the TN being lost to sedimentation; while for TP, for which no sediment release occurred in the current condition simulation, macrophyte removal did not impact water column levels of TP.
The simulations of enhanced lake level fluctuation with increased lake flushing and dilution, Floridan aquifer TN and TP concentrations of 0.07 mg/l and 0.01 mg/l, respectively, were used. For the scenario in which groundwater inflows provide 50 percent of the volume needed to refill the lake, the inflows were modeled to occur through June and July at a constant rate, during which time all other loading sources are reduced by half. For the scenario in which groundwater inflows provide 90 percent of the volume needed to refill the lake, the inflows were modeled to occur through June and July at a constant rate, during which time all other loading sources are reduced by 90 percent for the period. The assumption made in these scenarios is that water recovered from the proposed ASR well (see Management Component 2 under Section 4.3 below) would have nutrient concentrations similar to those observed in Floridan aquifer wells located within the Lake Tarpon basin.
The results of the model runs for the various scenarios are summarized in Table 3-5 below. The reported reduction in trophic state index (TSI) was based solely on simulated water column concentrations of TN and TP, and was determined by the difference between the scenario-based TSI and the simulated current condition TSI. Equations published by Huber et al. (1982) were used to calculate TSI as a function of TN and TP concentrations. These are:
TSI(TN) = 10(5.96+2.15ln[TN]), and
TSI(TP) = 10(2.36ln[TP]-2.38),
where [TN] and [TP] denote the in-lake concentration of TN and TP, respectively, in mg/l.
The aggregate nutrient-based TSI is calculated as a function of both the TN and TP concentrations, and is simply the average of the two individual nutrient-based TSIs. The aggregate nutrient-based TSI for the current condition simulation was 63.78.
Table 3-5. Results of box-model simulations of load reduction management actions.
Scenario |
[TN] (mg/l) |
[TP] (mg/l) |
TN TSI |
TP TSI |
(TN,TP) TSI |
(TN,TP) TSI Change |
Observed Conditions |
1.06 |
0.042 |
60.85 |
64.41 |
62.63 |
--- |
Simulated Current Conditions |
1.09 |
0.045 |
61.51 |
66.05 |
63.78 |
--- |
Septic Tank Conversion |
0.97 |
0.044 |
58.94 |
65.43 |
62.19 |
-1.59 |
Stormwater Treatment in Priority MHUs |
1.05 |
0.044 |
60.55 |
65.56 |
63.06 |
-0.72 |
Enhanced Lake Level Fluctuation |
1.17 |
0.045 |
63.05 |
66.20 |
64.63 |
+0.85 |
Macrophyte Harvesting |
1.08 |
0.045 |
61.28 |
66.05 |
63.67 |
-0.11 |
Septic Tank Conversion + Stormwater Treatment in Priority MHUs |
0.92 |
0.043 |
57.85 |
64.85 |
61.35 |
-2.43 |
Septic Tank Conversion + Enhanced Lake Level Fluctuation |
1.04 |
0.044 |
60.48 |
65.60 |
63.04 |
-0.74 |
Septic Tank Conversion + Macrophyte Harvesting |
0.96 |
0.044 |
58.67 |
65.43 |
62.05 |
-1.73 |
Stormwater Treatment in Priority MHUs + Enhanced Lake Level Fluctuation |
1.12 |
0.044 |
62.08 |
67.73 |
63.91 |
+0.13 |
Stormwater Treatment in Priority MHUs + Macrophyte Harvesting |
1.03 |
0.044 |
60.30 |
65.56 |
62.93 |
-0.85 |
Enhanced Lake Level Fluctuation + Macrophyte Harvesting |
1.16 |
0.045 |
62.81 |
66.20 |
64.51 |
+0.73 |
Septic Tank Conversion + Stormwater Treatment in Priority MHUs + Enhanced Lake Level Fluctuation |
0.99 |
0.043 |
59.39 |
65.05 |
62.22 |
-1.56 |
Septic Tank Conversion + Stormwater Treatment in Priority MHUs + Macrophyte Harvesting |
0.91 |
0.043 |
57.57 |
64.85 |
61.21 |
-2.57 |
Septic Tank Conversion + Enhanced Lake Level Fluctuation + Macrophyte Harvesting |
1.03 |
0.044 |
60.21 |
65.60 |
62.91 |
-0.87 |
Stormwater Treatment in Priority MHUs + Enhanced Lake Level Fluctuation + Macrophyte Harvesting |
1.11 |
0.044 |
61.84 |
65.73 |
63.79 |
+0.01 |
Stormwater Treatment in Priority MHUs + Septic Tank Conversion + Enhanced Lake Level Fluctuation + Macrophyte Harvesting |
0.98 |
0.045 |
59.11 |
65.05 |
62.95 |
-0.83 |
Enhanced Lake Level Fluctuation with Increased Lake Flushing and Dilution (50% refill) |
1.08 |
0.044 |
61.22 |
65.70 |
63.45 |
-0.33 |
Enhanced Lake Level Fluctuation with Increased Lake Flushing and Dilution (90% refill) |
0.98 |
0.043 |
59.24 |
64.77 |
62.01 |
-1.77 |
Stormwater Treatment in Priority MHUs + Septic Tank Conversion + Macrophyte Harvesting + Enhanced Lake Level Fluctuation + Increased Lake Flushing and Dilution (50% refill) |
0.91 |
0.042 |
57.59 |
64.52 |
61.06 |
-2.72 |
Stormwater Treatment in Priority MHUs + Septic Tank Conversion + Macrophyte Harvesting + Enhanced Lake Level Fluctuation + Increased Lake Flushing and Dilution (90% refill) |
0.83 |
0.041 |
55.64 |
63.63 |
59.64 |
-4.14 |
As shown in Table 3-5, the scenario which produces the greatest aggregate nutrient-based TSI reduction, without requiring increased lake flushing and dilution, is the combination of management actions that includes:
septic tank conversion;
stormwater treatment in priority MHUs; and
macrophyte harvesting.
This combination of management actions results in a simulated aggegrate nutrient-based TSI reduction of 2.57 TSI units.
These modeling results indicate that the enhanced lake level fluctuation management action will not lower the lake TSI, and may even result in a slight elevation of in-lake TN and TP concentrations. This is because the TN and TP concentrations of all of the inflows to the lake are slightly higher than the lake water itself, with the exception of precipitation. It should, however, be noted that the box-model approach used does not factor in the effects of increased flushing and reduced residence time on chlorophyll-a elaboration; nor does it account for other internal processes such as lake acidification from surficial aquifer seepage, which may have played a significant role in suppressing chlorophyll-a concentrations following the accidental lake drawdown that occurred in 1990. Based on empirical evidence observed during 1990 and 1991, following the accidental lake drawdown, it is concluded that the complex physical/chemical interactions associated with enhanced lake level fluctuation cannot be accurately simulated, and that water quality benefits can reasonably be expected from the implementation of this management action.
When increased lake flushing and dilution is included as a component of the enhanced lake level fluctuation management action, the simulated TSI reduction improves substantially. The most effective combination of management actions with respect to TSI reduction include:
stormwater treatment in priority MHUs;
septic tank conversion;
macrophyte harvesting; and
enhanced lake level fluctuation with increased lake flushing and dilution.
If 50 percent of the discharged lake volume is refilled with groundwater recovered from the proposed ASR well, this combination of management actions results in a simulated TSI reduction of 2.72 TSI points. However, if 90 percent of the discharged lake volume is refilled with groundwater from the ASR well, this combination of management actions results in a simulated TSI reduction 4.14 TSI points. These results demonstrate the potential effectiveness of lake flushing and dilution as a means of reducing the lake TSI, especially when a highly dilute source of water is used.
As discussed in Section 4.0 - The Plan - below, a multi-parameter TSI target of 55 (e.g., calculated using [TN], [TP], [Chl-a], and secchi depth) is recommended for Lake Tarpon. Based on 1995 water quality data, the current multi-parameter TSI of Lake Tarpon is approximately 59. Therefore, in order to reach the target TSI of 55, a 4 point reduction in TSI will be needed. The analysis presented above demonstrates that a TSI reduction of over 4 points is achievable through the implementation of the major internal and external load reductions management actions considered in the Plan. Furthermore, this potential load reduction was calculated using a box-model approach that treats the load reductions associated with the various management actions on a conservative mass balance basis. This approach does not account for numerous complex physical, chemical and biological interactions (e.g., reduced residence time, lake acidification, etc.) that may amplify the TSI reduction associated with the various management actions.
Finally, it should be noted that the Plan described in the following sections includes numerous other non-structural components that, if fully implemented, should lead to further nutrient load reduction. Examples of these non-structural management actions include:
inventory permitted MSSW facilities in the Lake Tarpon Basin and develop facility improvement plans;
adopt a resolution designating the Lake Tarpon basin as a "nutrient sensitive watershed"; and
develop and implement a comprehensive public involvement and education program for the Take Tarpon watershed
.
In conclusion, the multi-parametric TSI target of 55 for Lake Tarpon is attainable, but achieving this target will require the full implementation of the major internal and external load reduction strategies, including:
stormwater treatment in priority MHUs;
septic tank conversion;
macrophyte harvesting; and
enhanced lake level fluctuation with increased lake flushing and dilution.
It should be noted that the predicted attainment of the TSI target assumes that current conditions will prevail, and that no major hydrologic alterations or additional loadings will occur within the basin. Implementation of other non-structural components of the recommended Plan will likely lead to further load reduction which should provide a small safety factor to accomodate future growth. This point, however, underscores the importance of implementing the full Plan as proposed such that future growth and development in the basin will not lead to further degradation of water quality and associated living resources in Lake Tarpon.